So we had a strong cold front recently – with winds in excess of 30kt and some torrential rain. So it was a day for being indoors – even although we never saw the winds that the forecasters said would be in excess of 50kt!
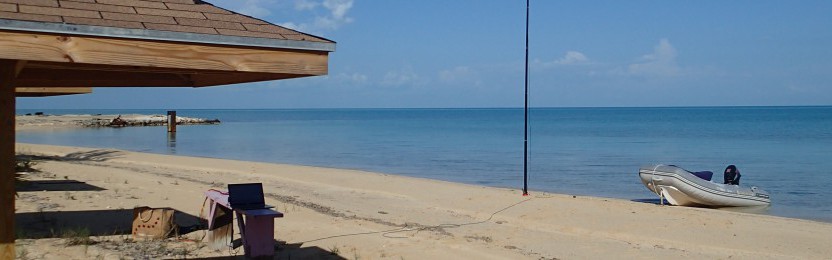
As we set out for our trip to the Bahamas this year, our Raymarine E120 chart plotter failed. Well, the backlight to the LCD failed – the repair shall be the subject of another blog sometime but suffice it to say that the interim repair is satisfactory. However, it got me thinking about backups – and the inclement weather got me thinking about it even more. You see, our chart plotter and instrumentation is outside at the helm rather than inside where, if the weather’s bad, its warm and cosy. Ideally, I want to be able to monitor the conditions outside from my bunk or perhaps the saloon rather than popping outsinde in the rain.
Now, I’ve been playing with something called Node-Red for a while now as I develop sensors and a Hovercraft instrumentation system and other stuff. Its a great tool for ‘wiring’ data together. With a little inspiration from Peter Scargill’s blog, I discovered the Steelseries guages that would allow me to display the wind (and other navigation) data on my phone or tablet.
The result is here:
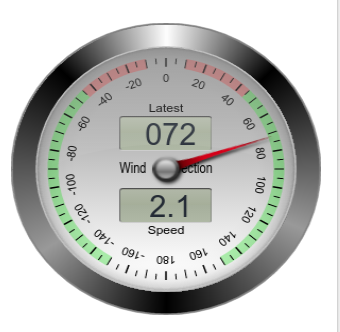 Its a fully animated apparent wind display. I had to amend the Steelseries guage javascript file to declare a new (and very small) pointer type in order to ‘hide’ the second pointer. Another few lines of code added a parameter ‘windspeed’ that re-purposes the lower LCD segment to display the wind speed to a single decimal place. In all, only a few lines of code.
I use a cheap ($2) RS485 adapter to read the data off my NMEA bus directly into Node-Red (running on a Raspberry Pi) and then display the Steelseries guages in Node-red dashboard. (For details on the ‘how’ – its documented well on Pete’s blog).
Of course, by the time i’d got it all figured out the cold front had passed and it was time to get back to everyday tasks. I’m not sure whether to fork the Steelseries or push my amendments to the original – perhaps some of you would like to chip in and give a thought on that?
In the mean time, I have a few more ideas brewing as well as the need to expand my displays to give a full ‘virtual’ chart plotter information display. (Updated code here)
Node red Template code:
/myjs/tween-min.js
/myjs/steelseries-2-min.js
var windDir1;
(function(scope){
scope.$watch(‘msg’, function(msg) {
if (typeof(msg.value) != “undefined”) windDir1.setValueAnimatedLatest(msg.value);
if (typeof(msg.ave) != “undefined”) windDir1.setValueAnimatedAverage(msg.ave);
});
})(scope);
var sections = [steelseries.Section(10, 45, ‘rgba(220, 0, 0, 0.3)’),
steelseries.Section(45, 150, ‘rgba(0, 220, 0, 0.3)’),
steelseries.Section(315, 350, ‘rgba(220, 0, 0, 0.3)’),
steelseries.Section(210, 315, ‘rgba(0, 220, 0, 0.3)’)]
windDir1 = new steelseries.WindDirection(‘canvasWindDir2’, {
size: 292,
section: sections,
lcdVisible: true,
titleString: “Wind Direction”,
degreeScaleHalf: true,
pointSymbolsVisible: false,
lcdTitleStrings: [‘Latest’, ‘Speed’],
windspeed: true
});
windDir1.setFrameDesign(steelseries.FrameDesign.BLACK_METAL);
windDir1.setBackgroundColor(steelseries.BackgroundColor.LIGHT_GRAY);
windDir1.setPointerTypeAverage(steelseries.PointerType.TYPE17);
windDir1.setPointerType(steelseries.PointerType.TYPE1);
<canvas id=”canvasWindDir2″ width=”292″ height=”292″></canvas>

how did you get the degree symbol off the lower LCD segment
jim
I’m sorry I can’t remember but I think it was just a case of editing the character out.